Metrics
The purpose of this page is to generate a performance comparison between states, devices, or locations. The date range for generating this comparison is selected in the calendar in the upper right corner.
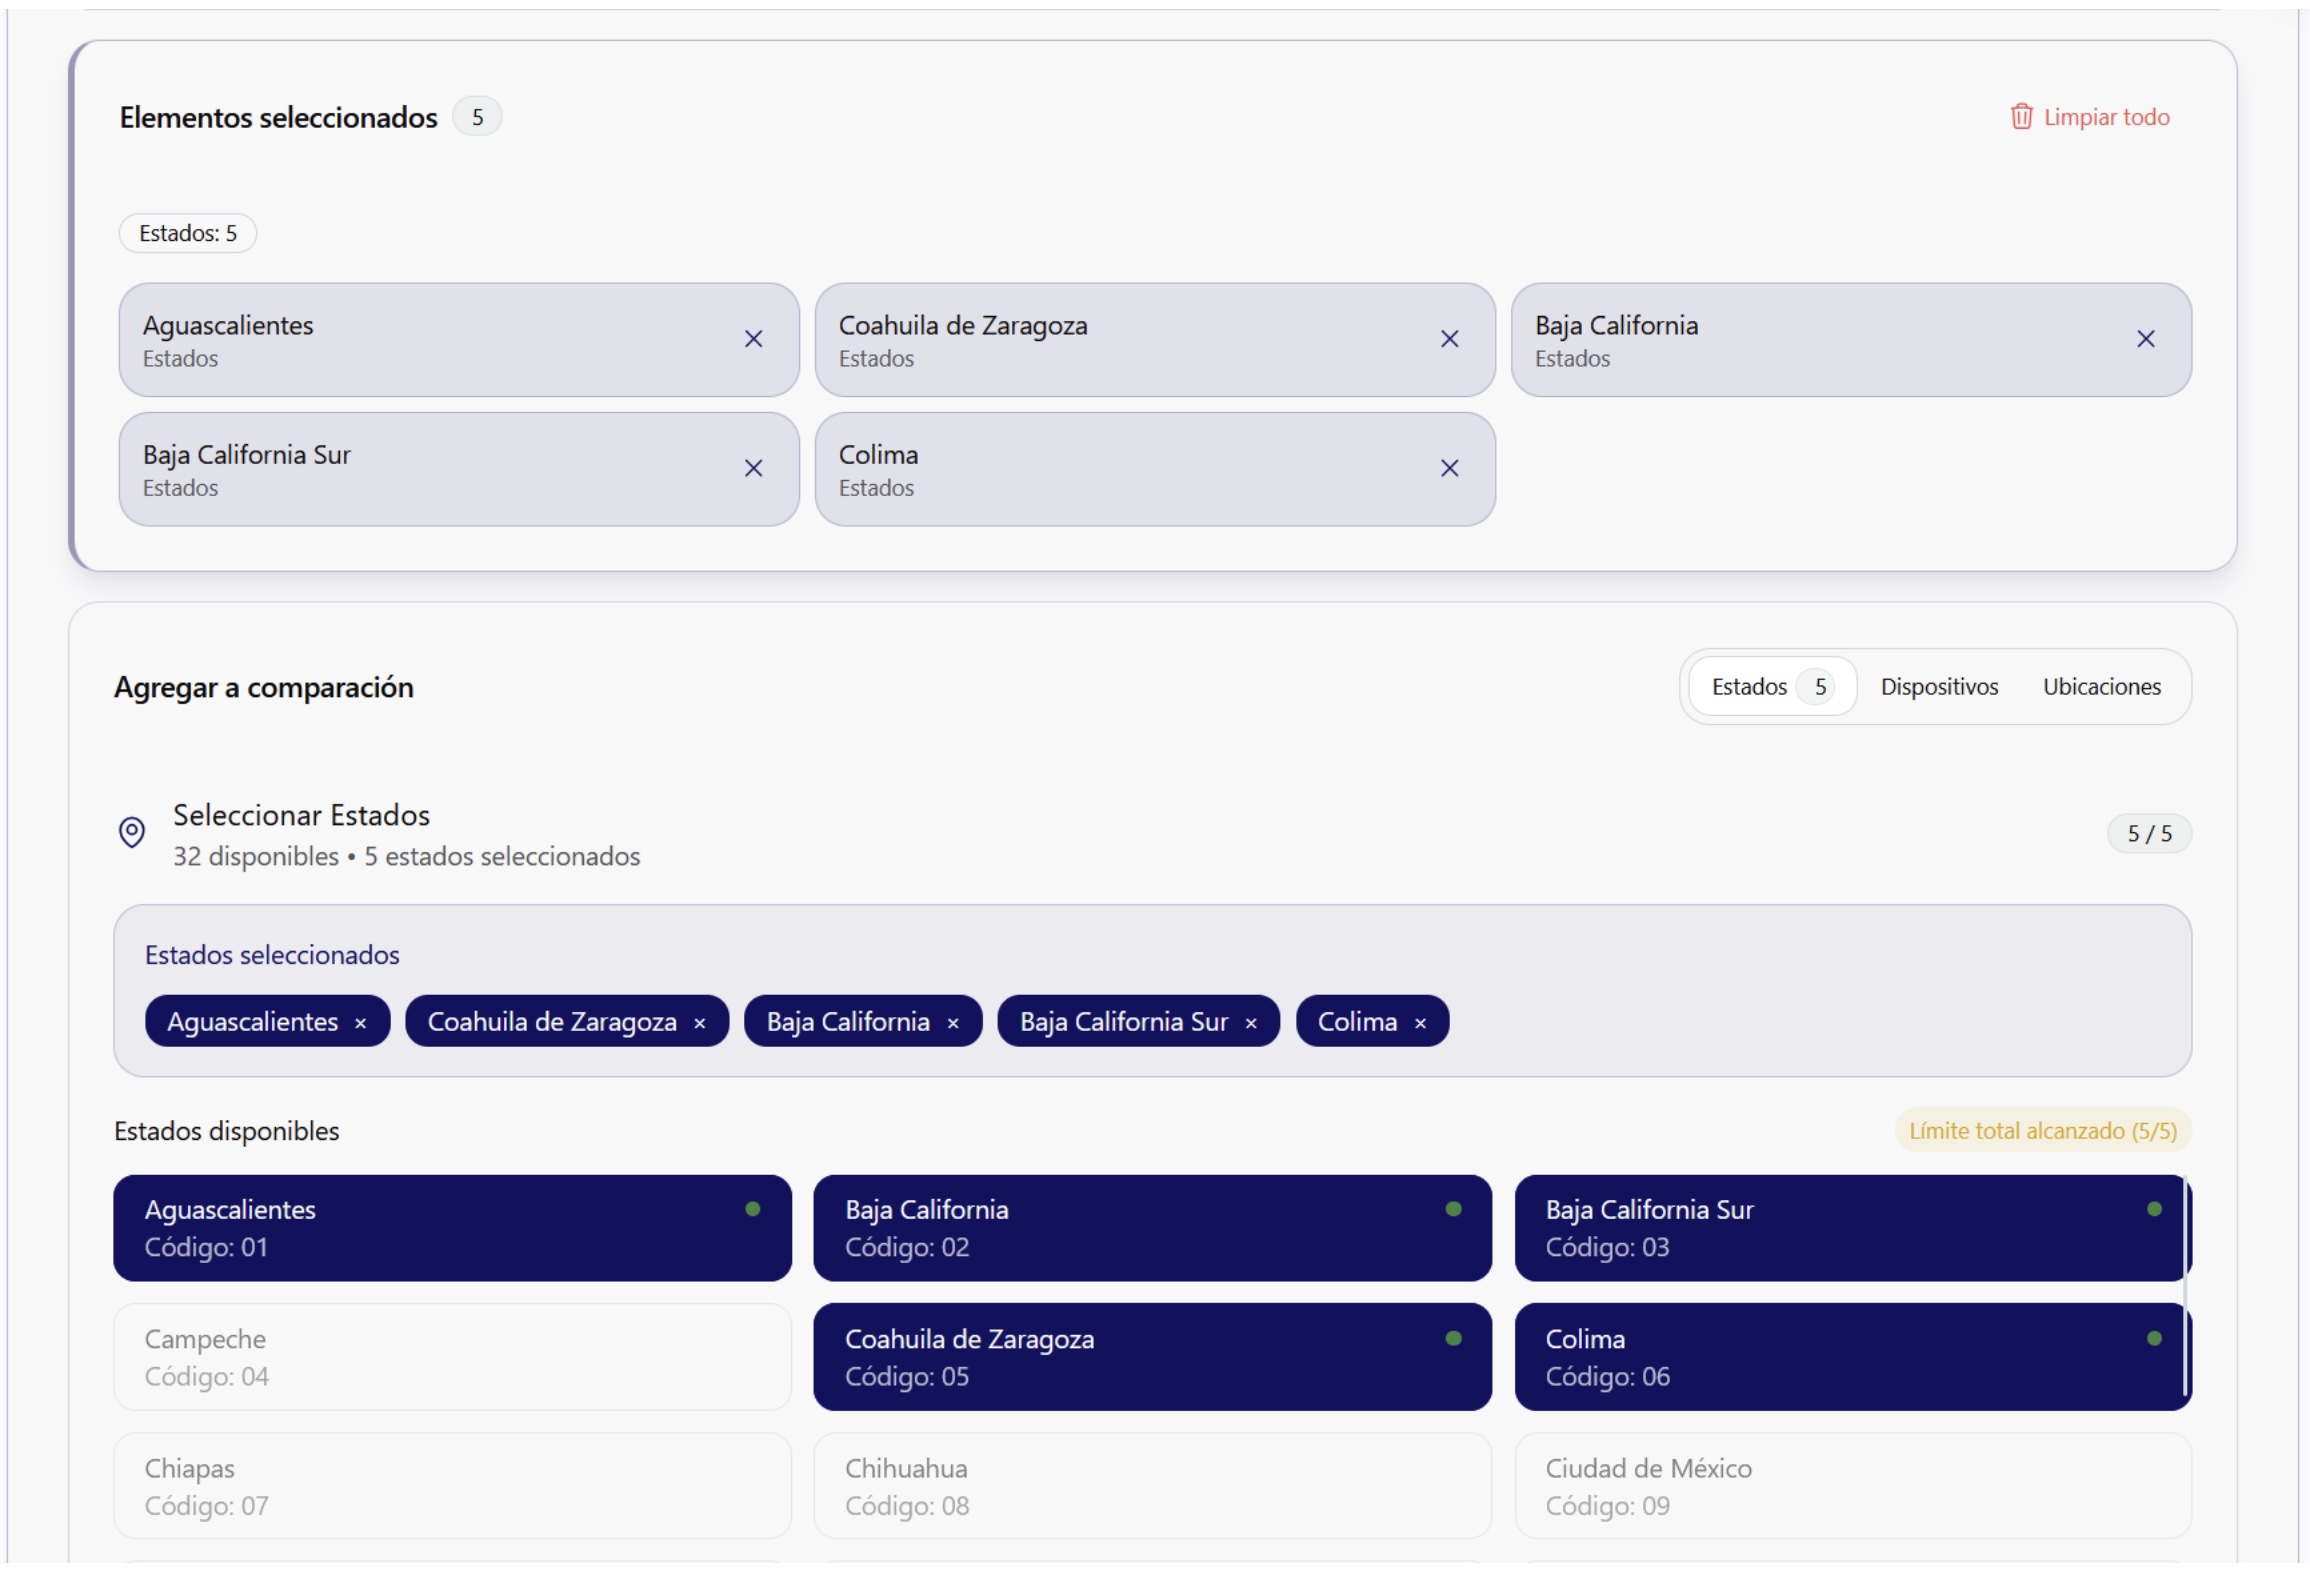
By clicking on the "Select elements" button, the list of states with their respective state code (two-digit number) is displayed. The first step to make the comparison is to select the state. We can buy a maximum of 5 elements.

Once "Select elements" is displayed, an additional section named "Add to comparison" will be shown with the list of all states to start the selection. As the states are selected, they will be highlighted and added to the top row.
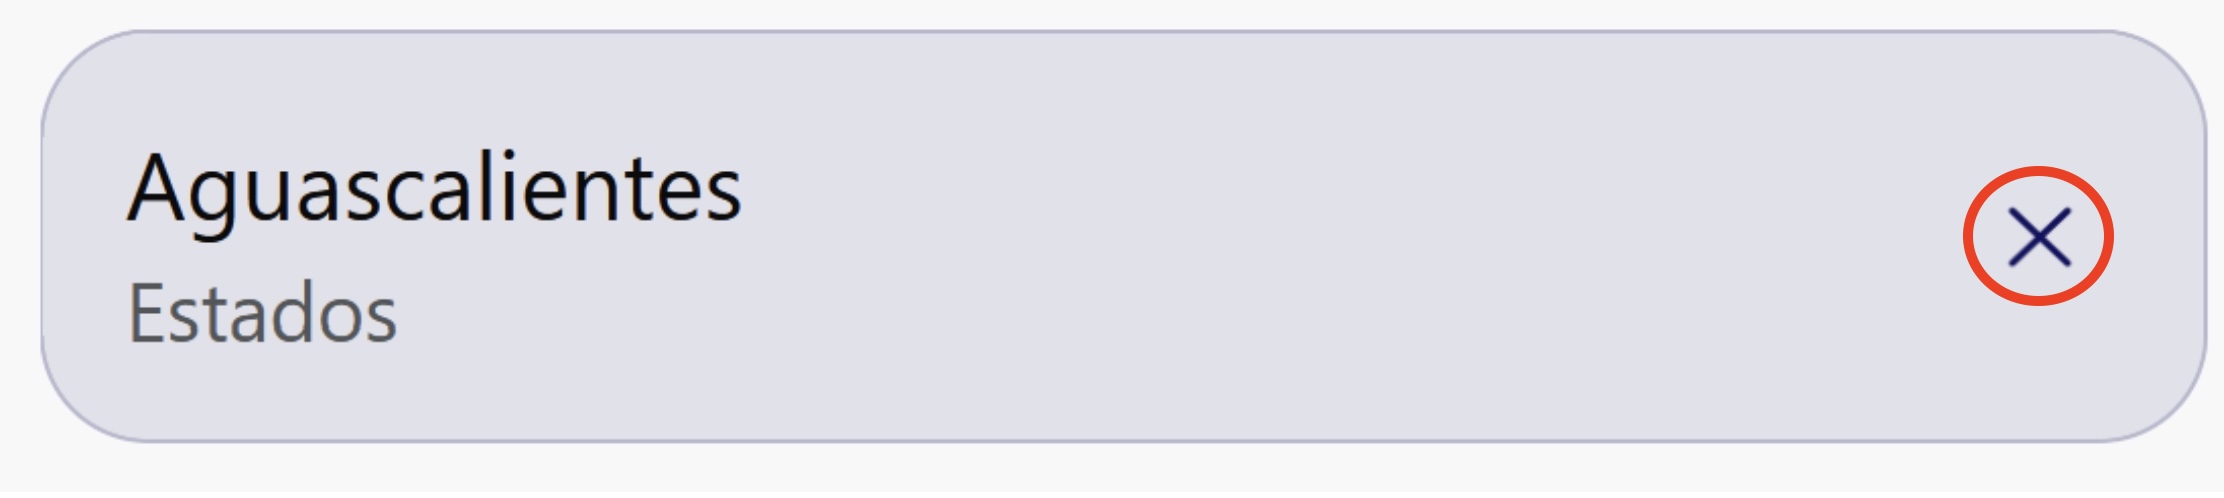
To remove a state or any element, simply click on the "X" that is shown to the right of the name:
To remove all selected elements, click on the "Clear all" button in the upper right corner of the "Selected elements" card.
Devices or locations can only be compared after selecting the state to which they correspond.
📊 Executive Summary
If you are satisfied with the selection of states, the "Start comparison" button will display the information in the "Executive Summary" section, which shows the following data.
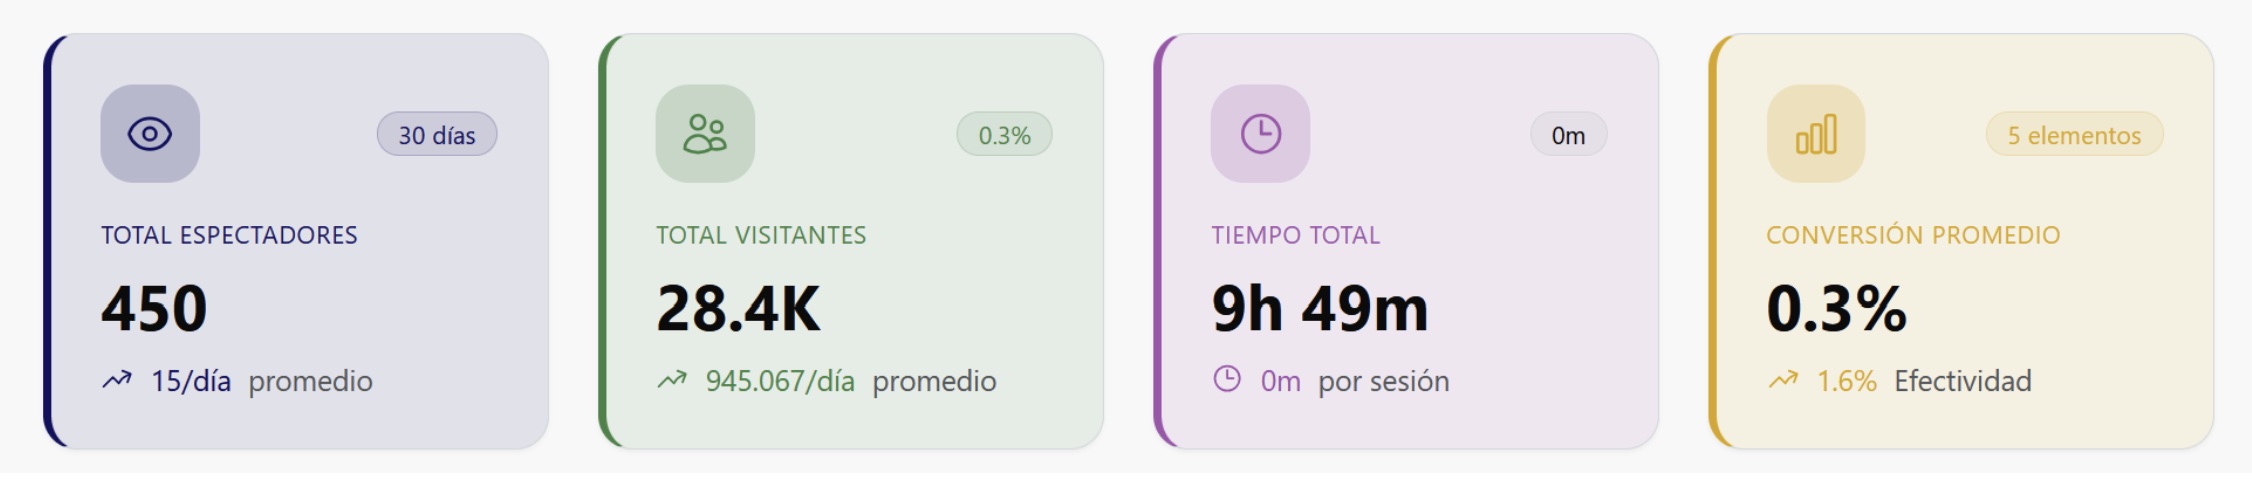
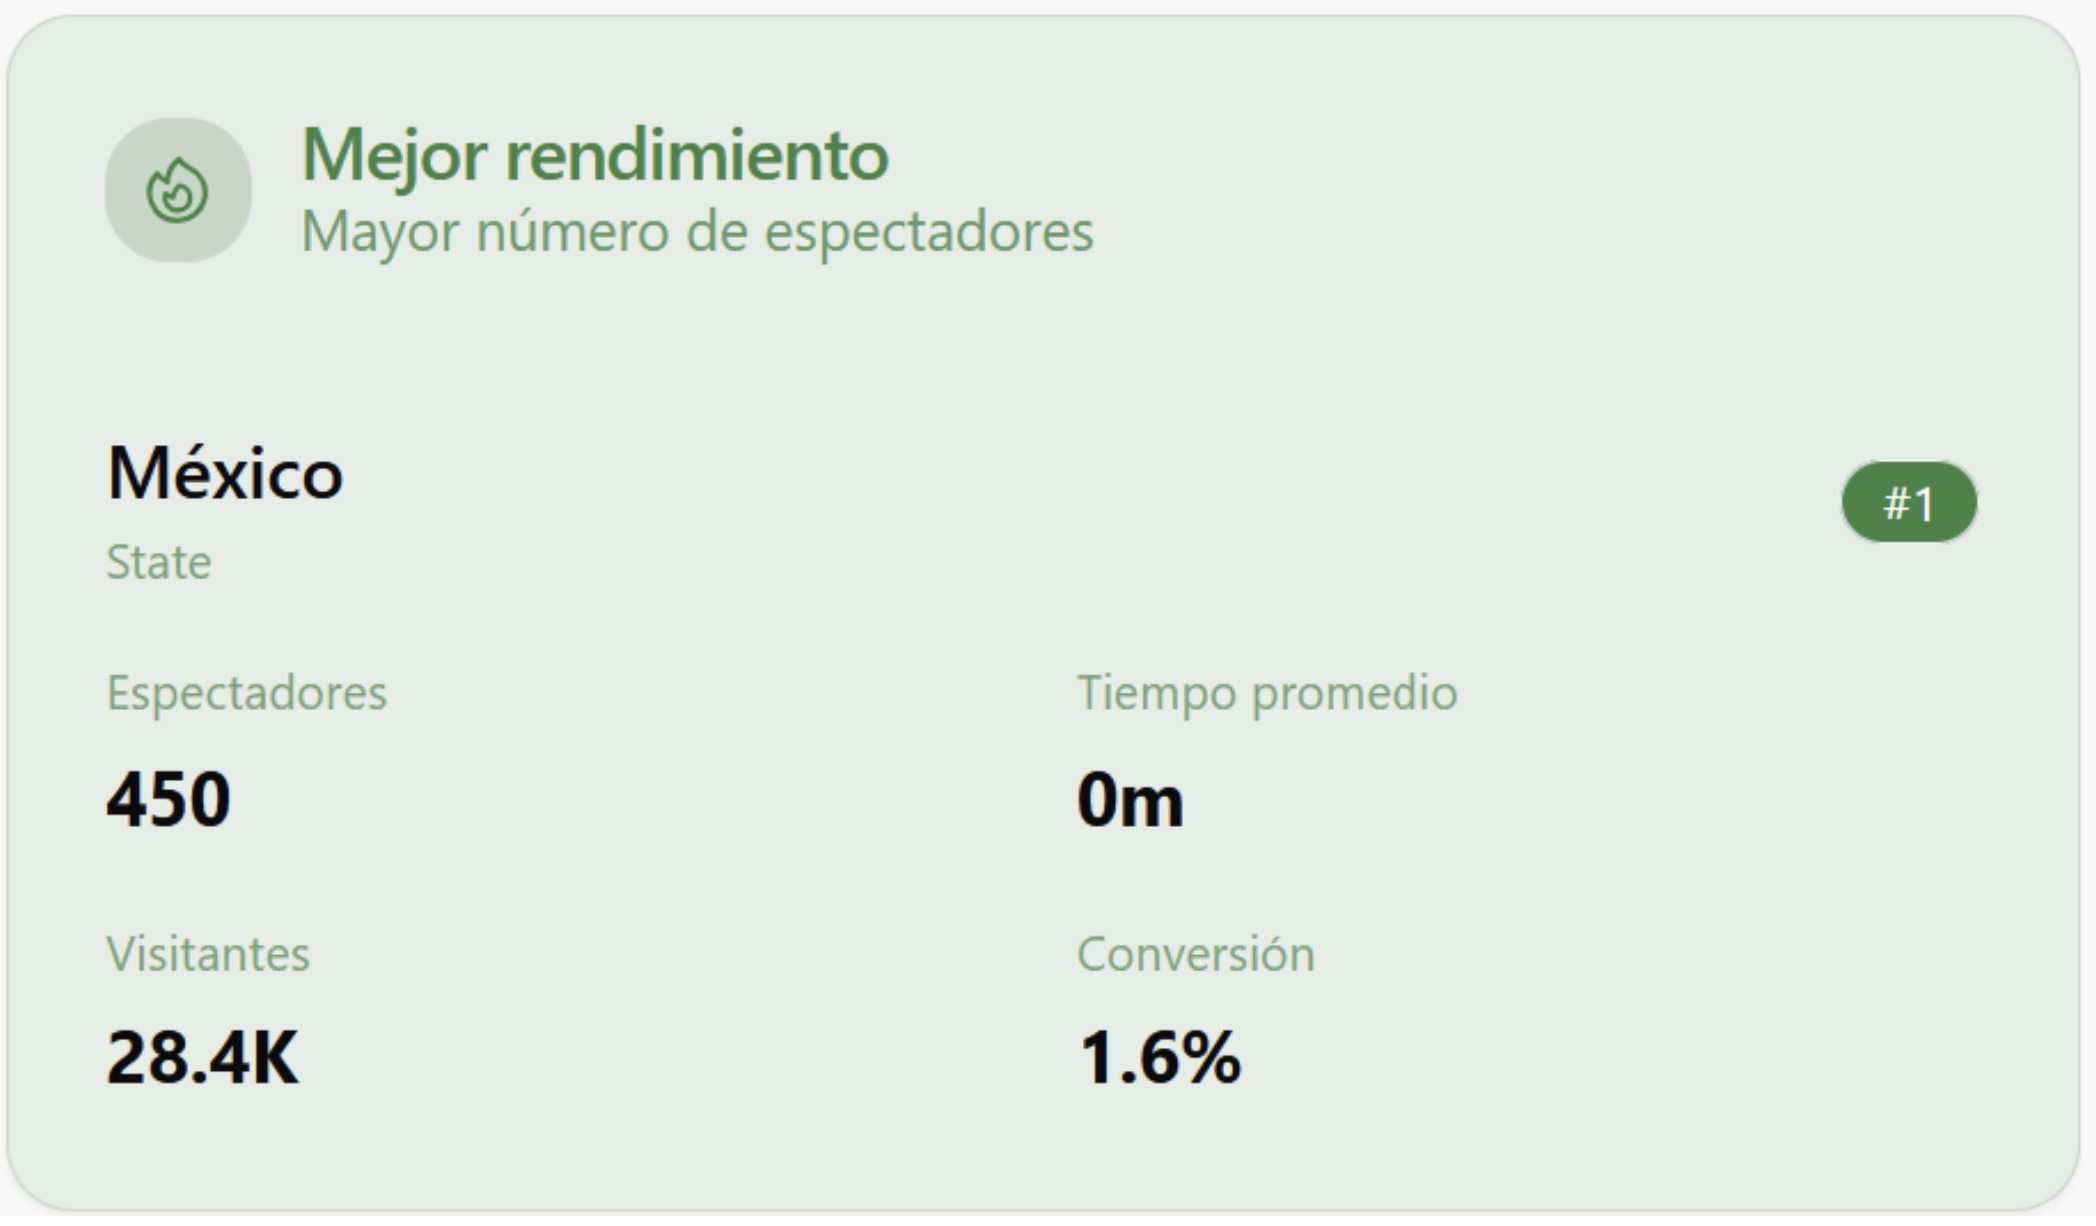
This number refers to all selected states. In the upper right corner, it shows the number of days analyzed. This number of days is the same as the one selected in the calendar. In the lower left corner, it shows the average number of viewers that have been registered.
Refers to the number of people who were identified within the range of vision of the cameras.
Indicates the amount of time that viewers were detected, that is, the time that all the people detected watched the content.
Percentage of visitors (people detected) who become viewers (people who watch the content). In the example shown, it can be seen that only 0.3% of visitors become viewers. This percentage varies depending on the number of elements we are comparing, since it calculates it in its entirety.
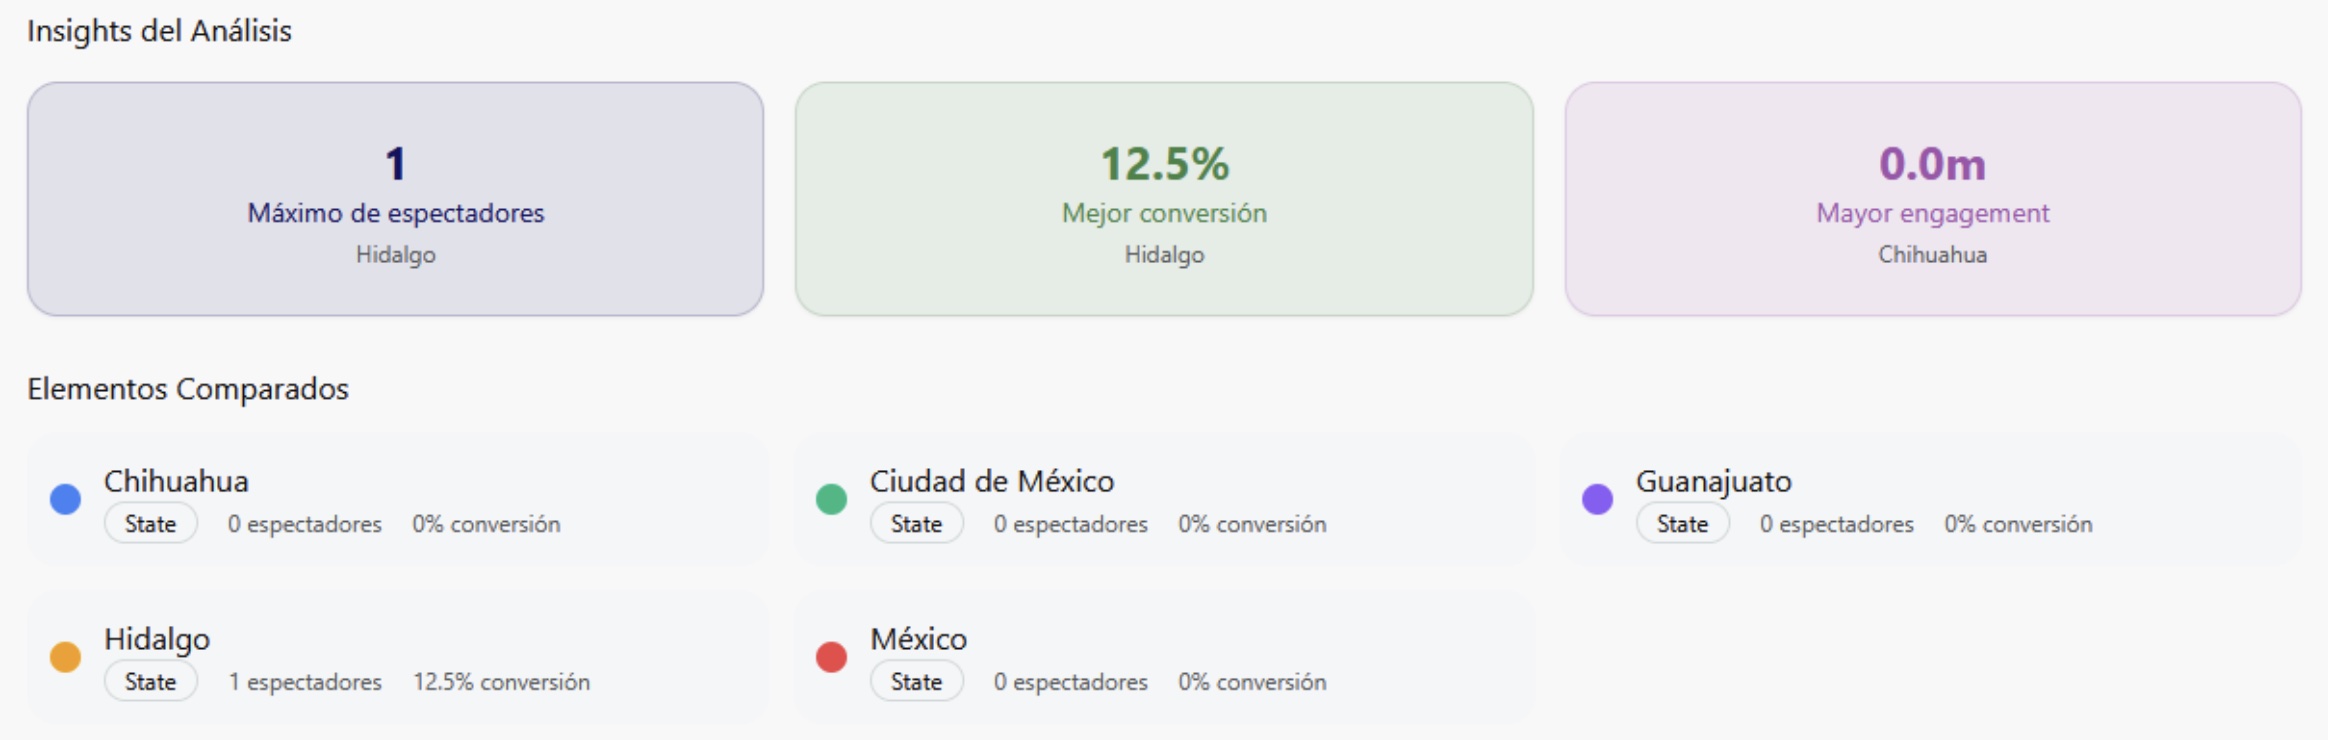
The executive summary also shows the state with the best performance with its respective data.
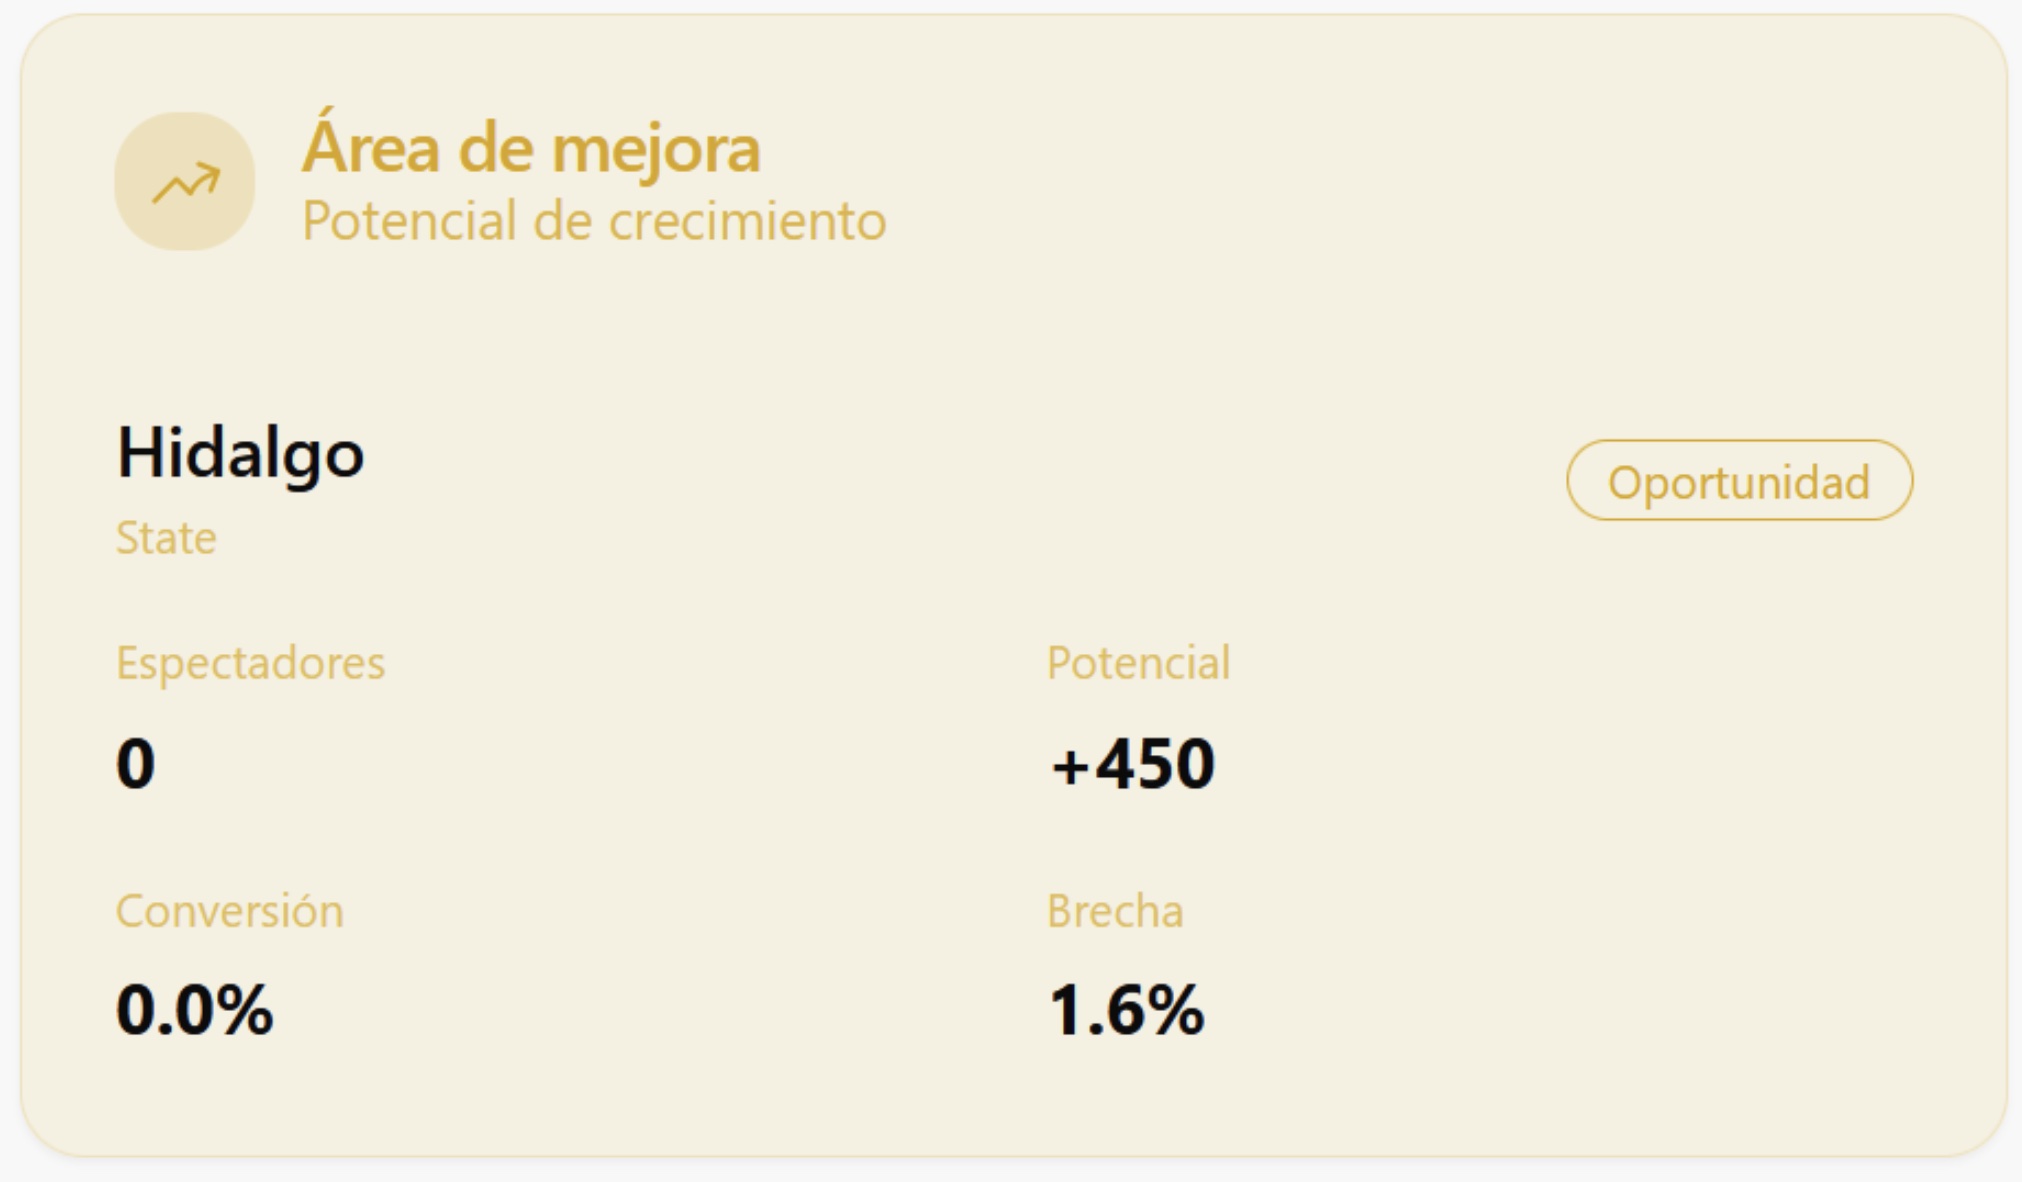
At the same time, the area of opportunity is also shown, that is, the element with the lowest performance in this way.
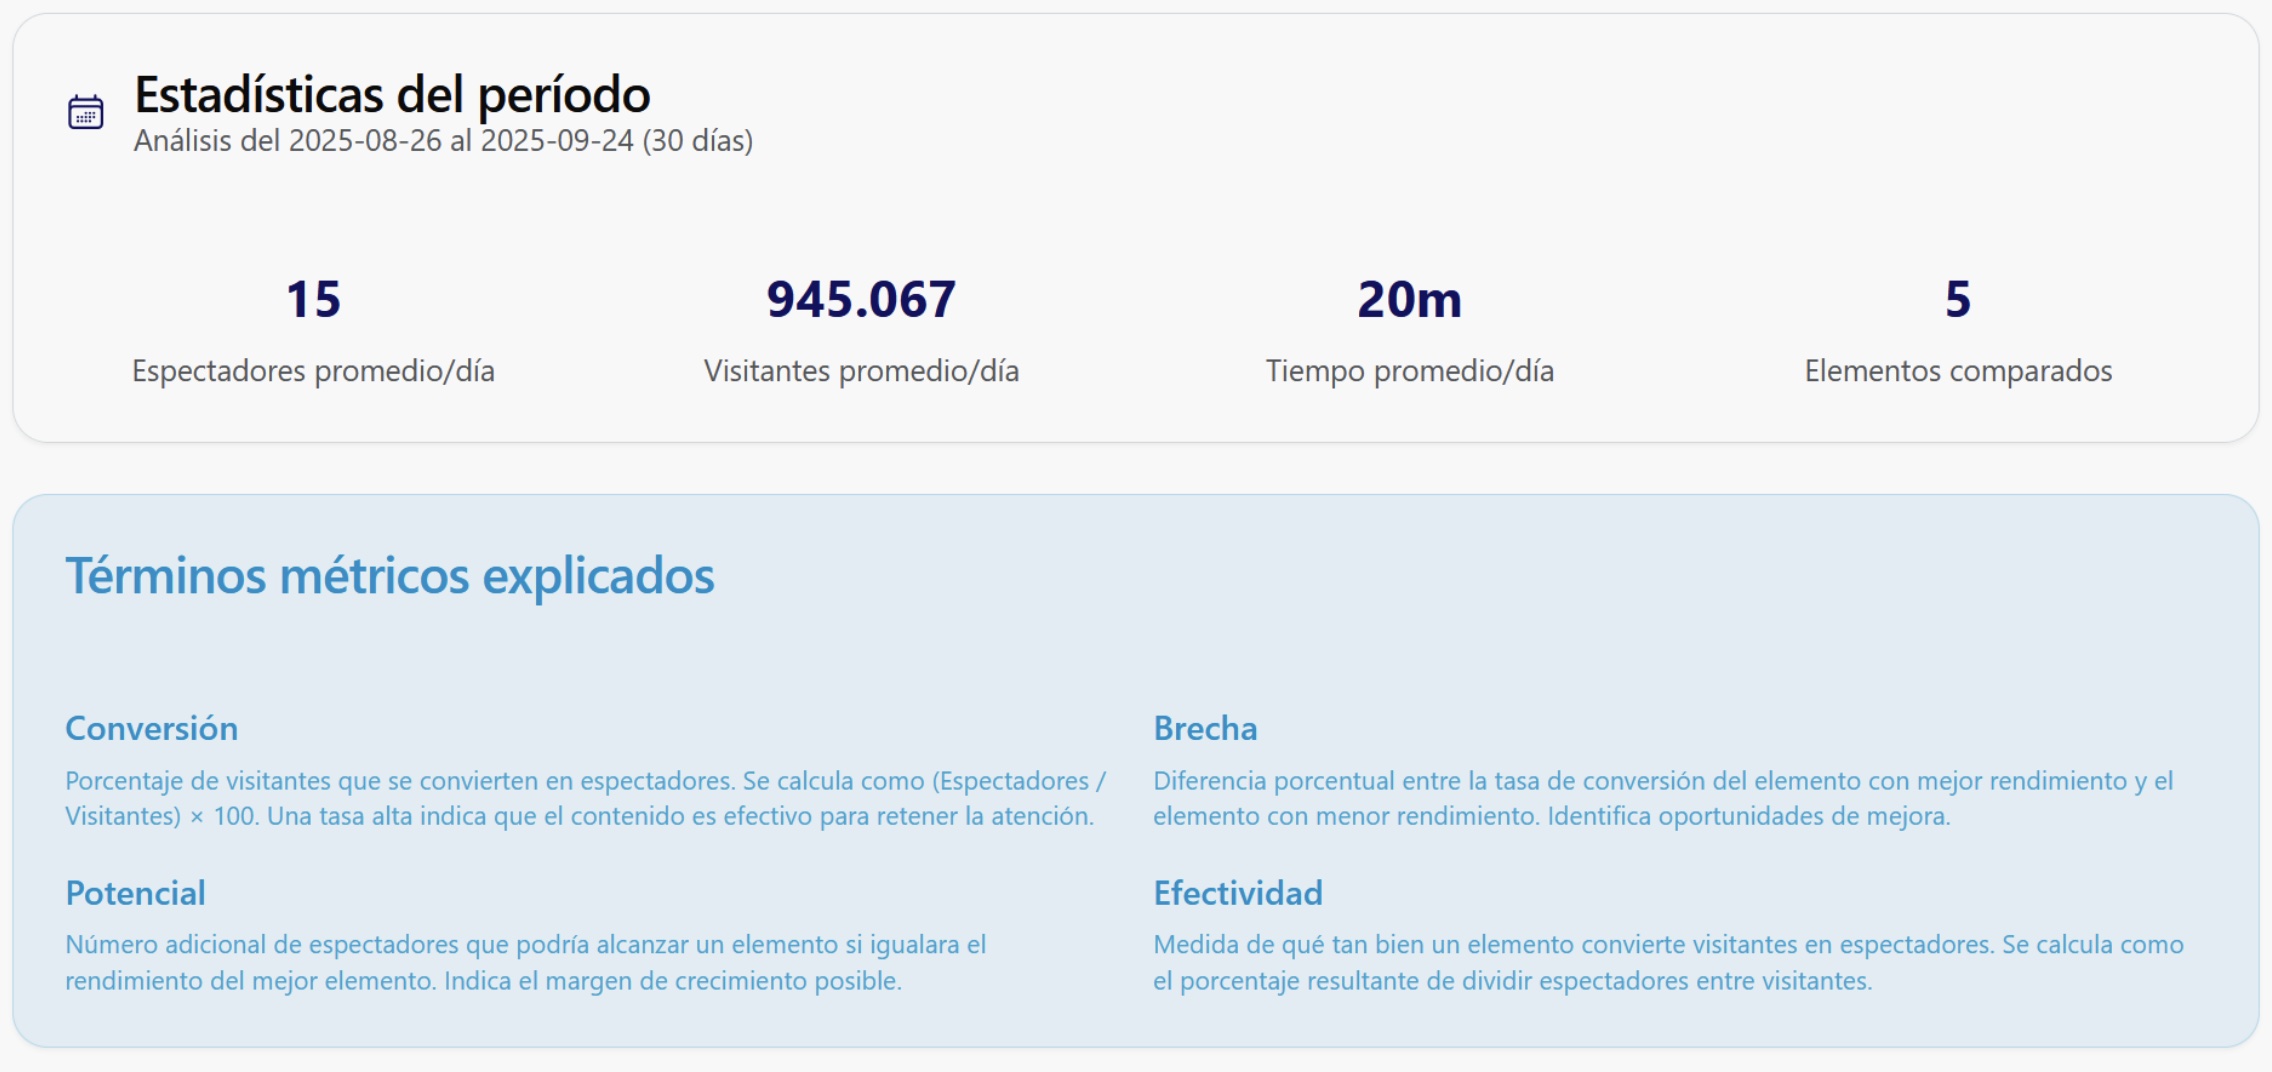
Below are the general statistics of the period with the selected range, as well as the terms used to perform the comparison.
🧐 Detailed Visual Analysis
Derived from the data in the executive summary, this section generates a series of graphs, which expose the information in various ways. The default graph is the bar graph.
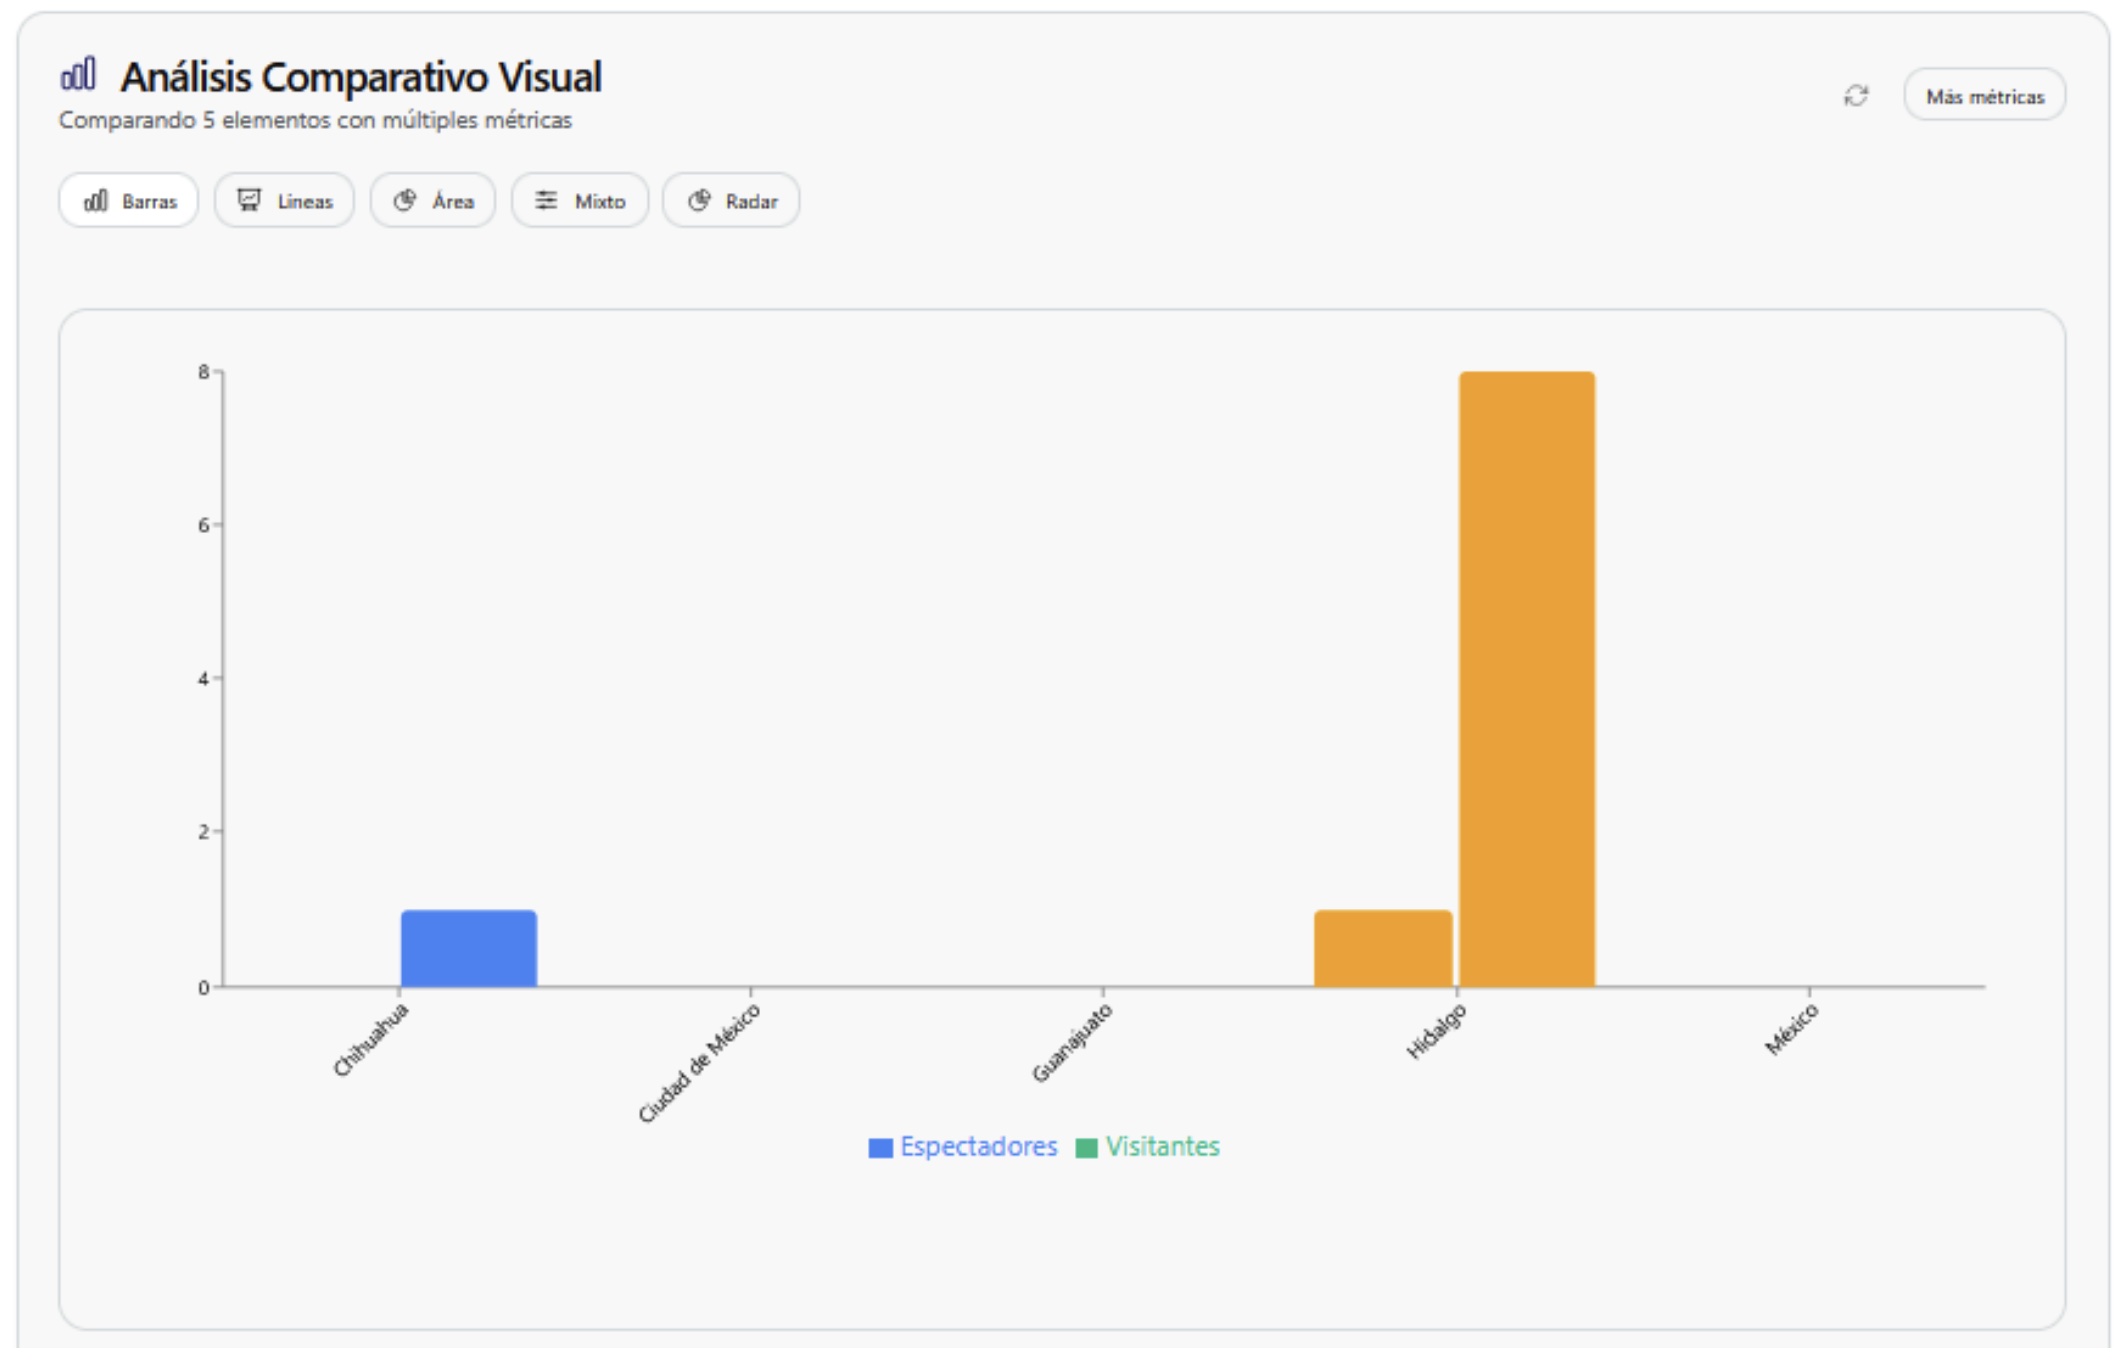
Initially, it will only show information on viewers and visitors however, the "More metrics" button in the upper right corner also allows you to show the average time in minutes.
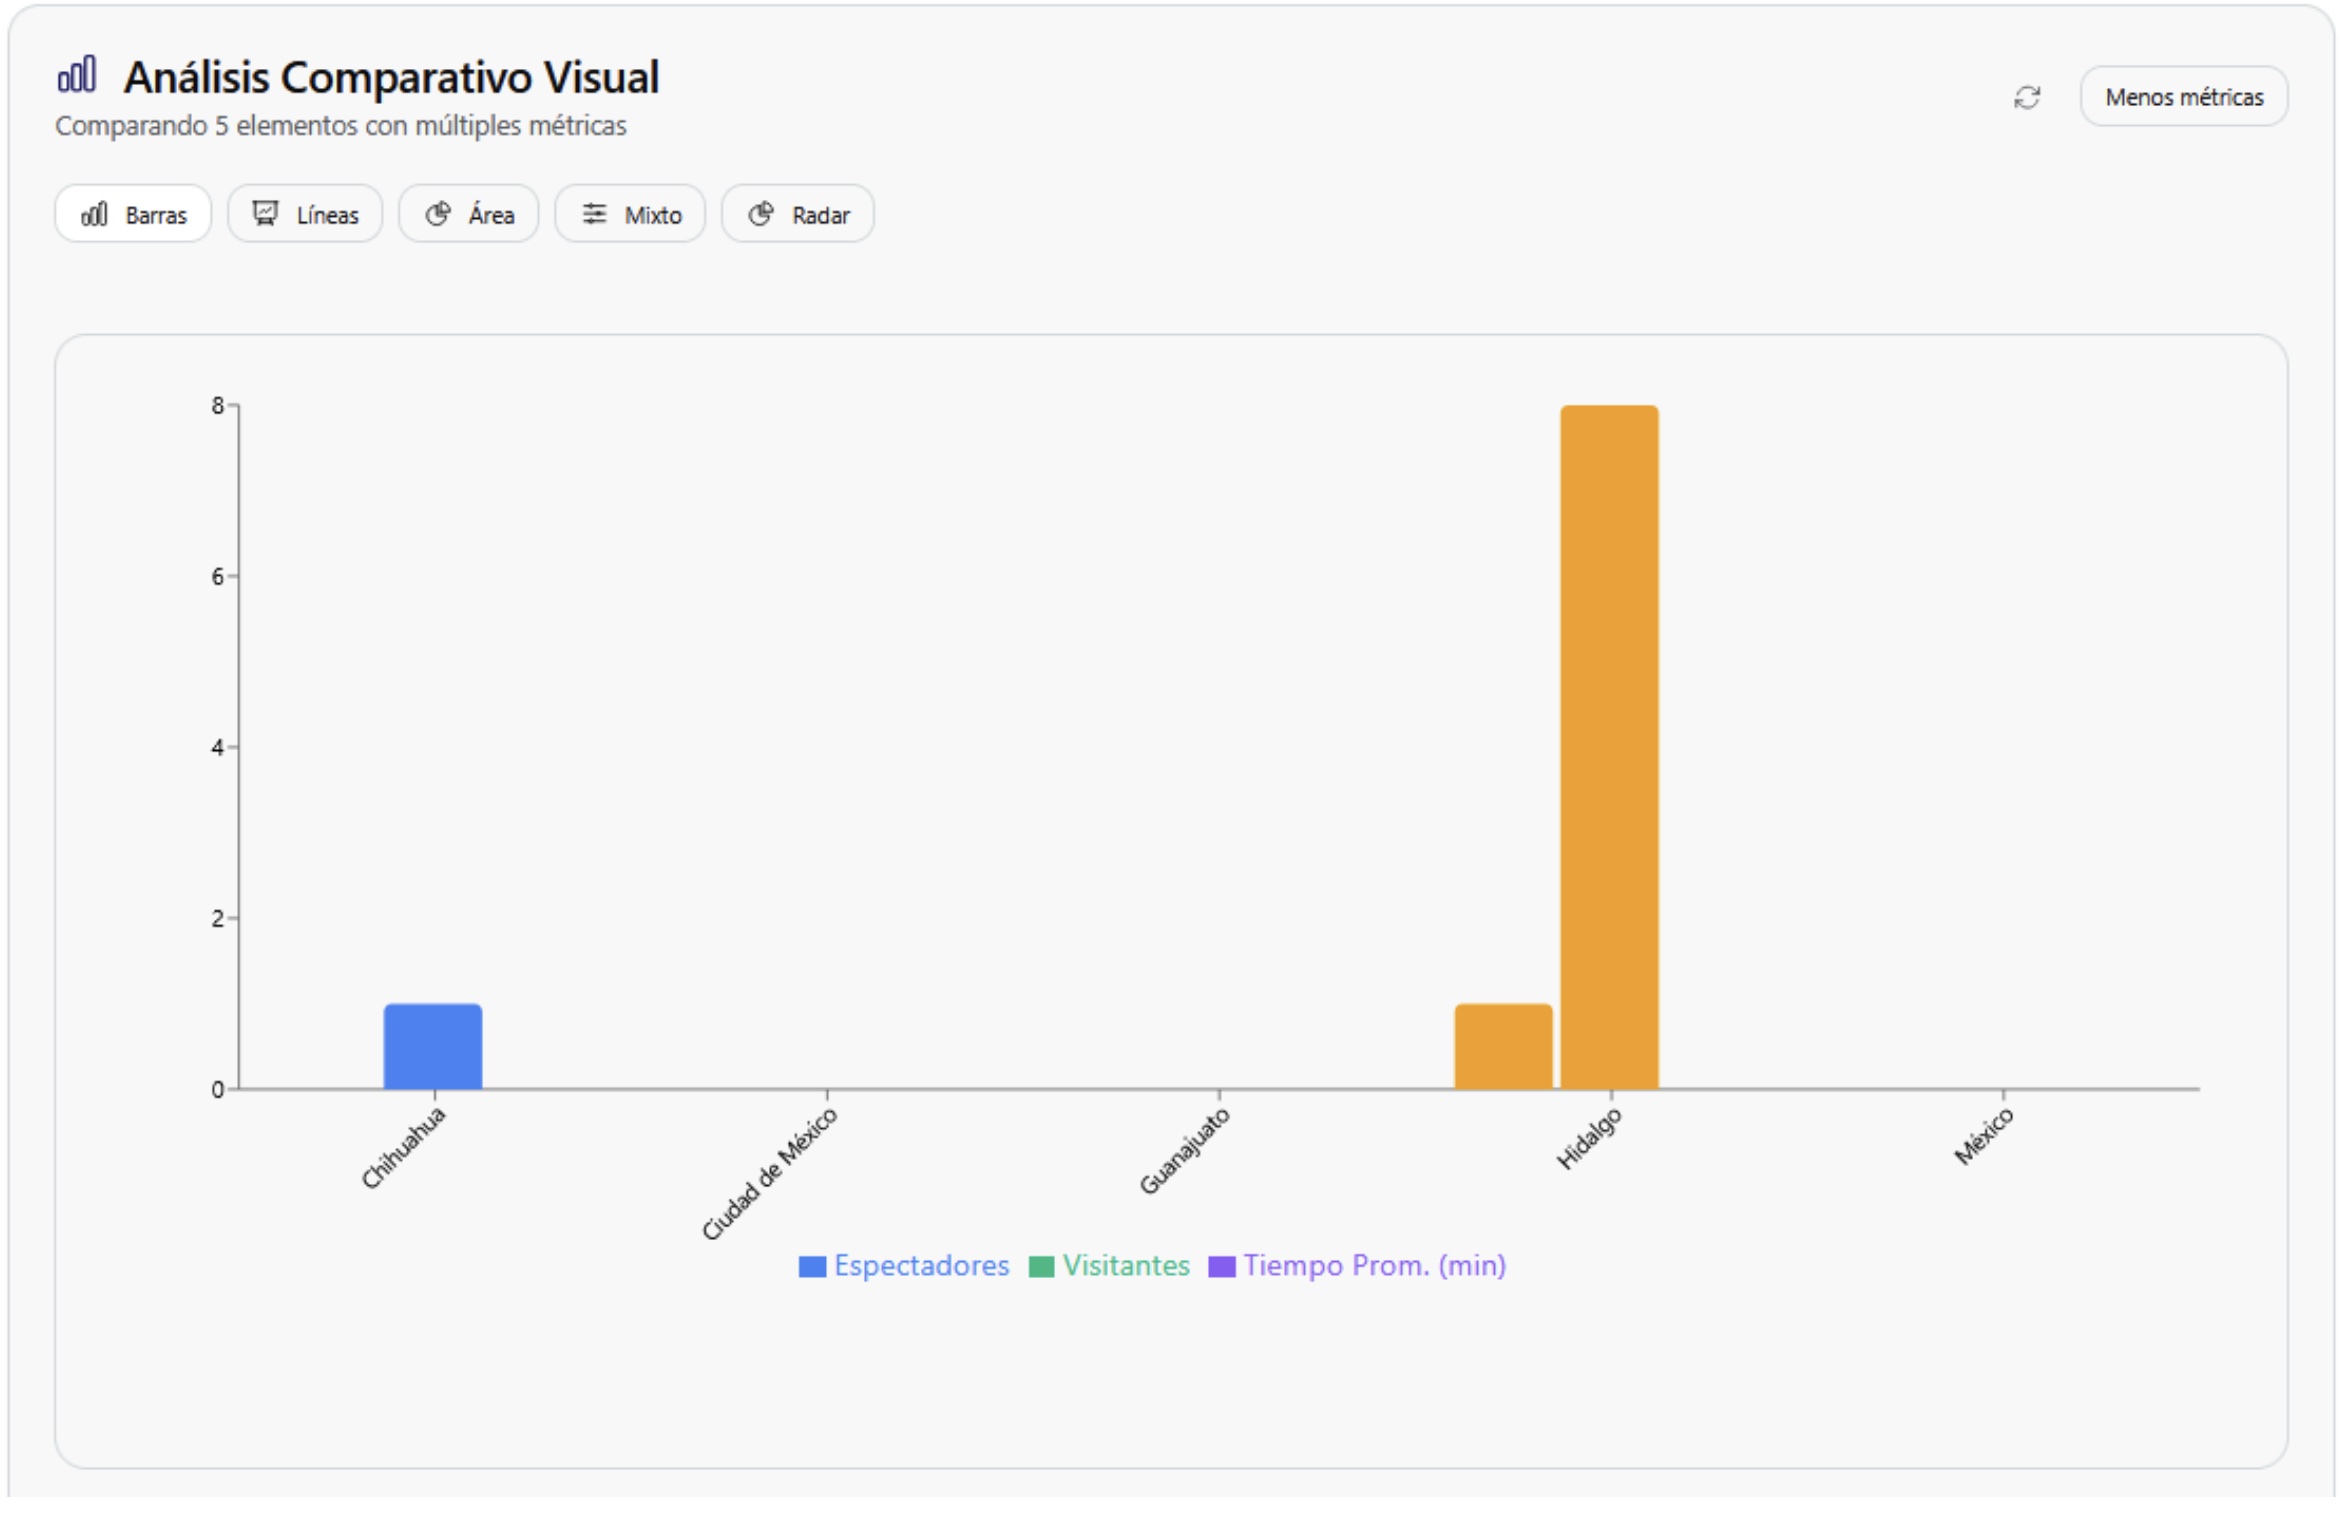
Placing the cursor over a graph shows more information about the compared element.
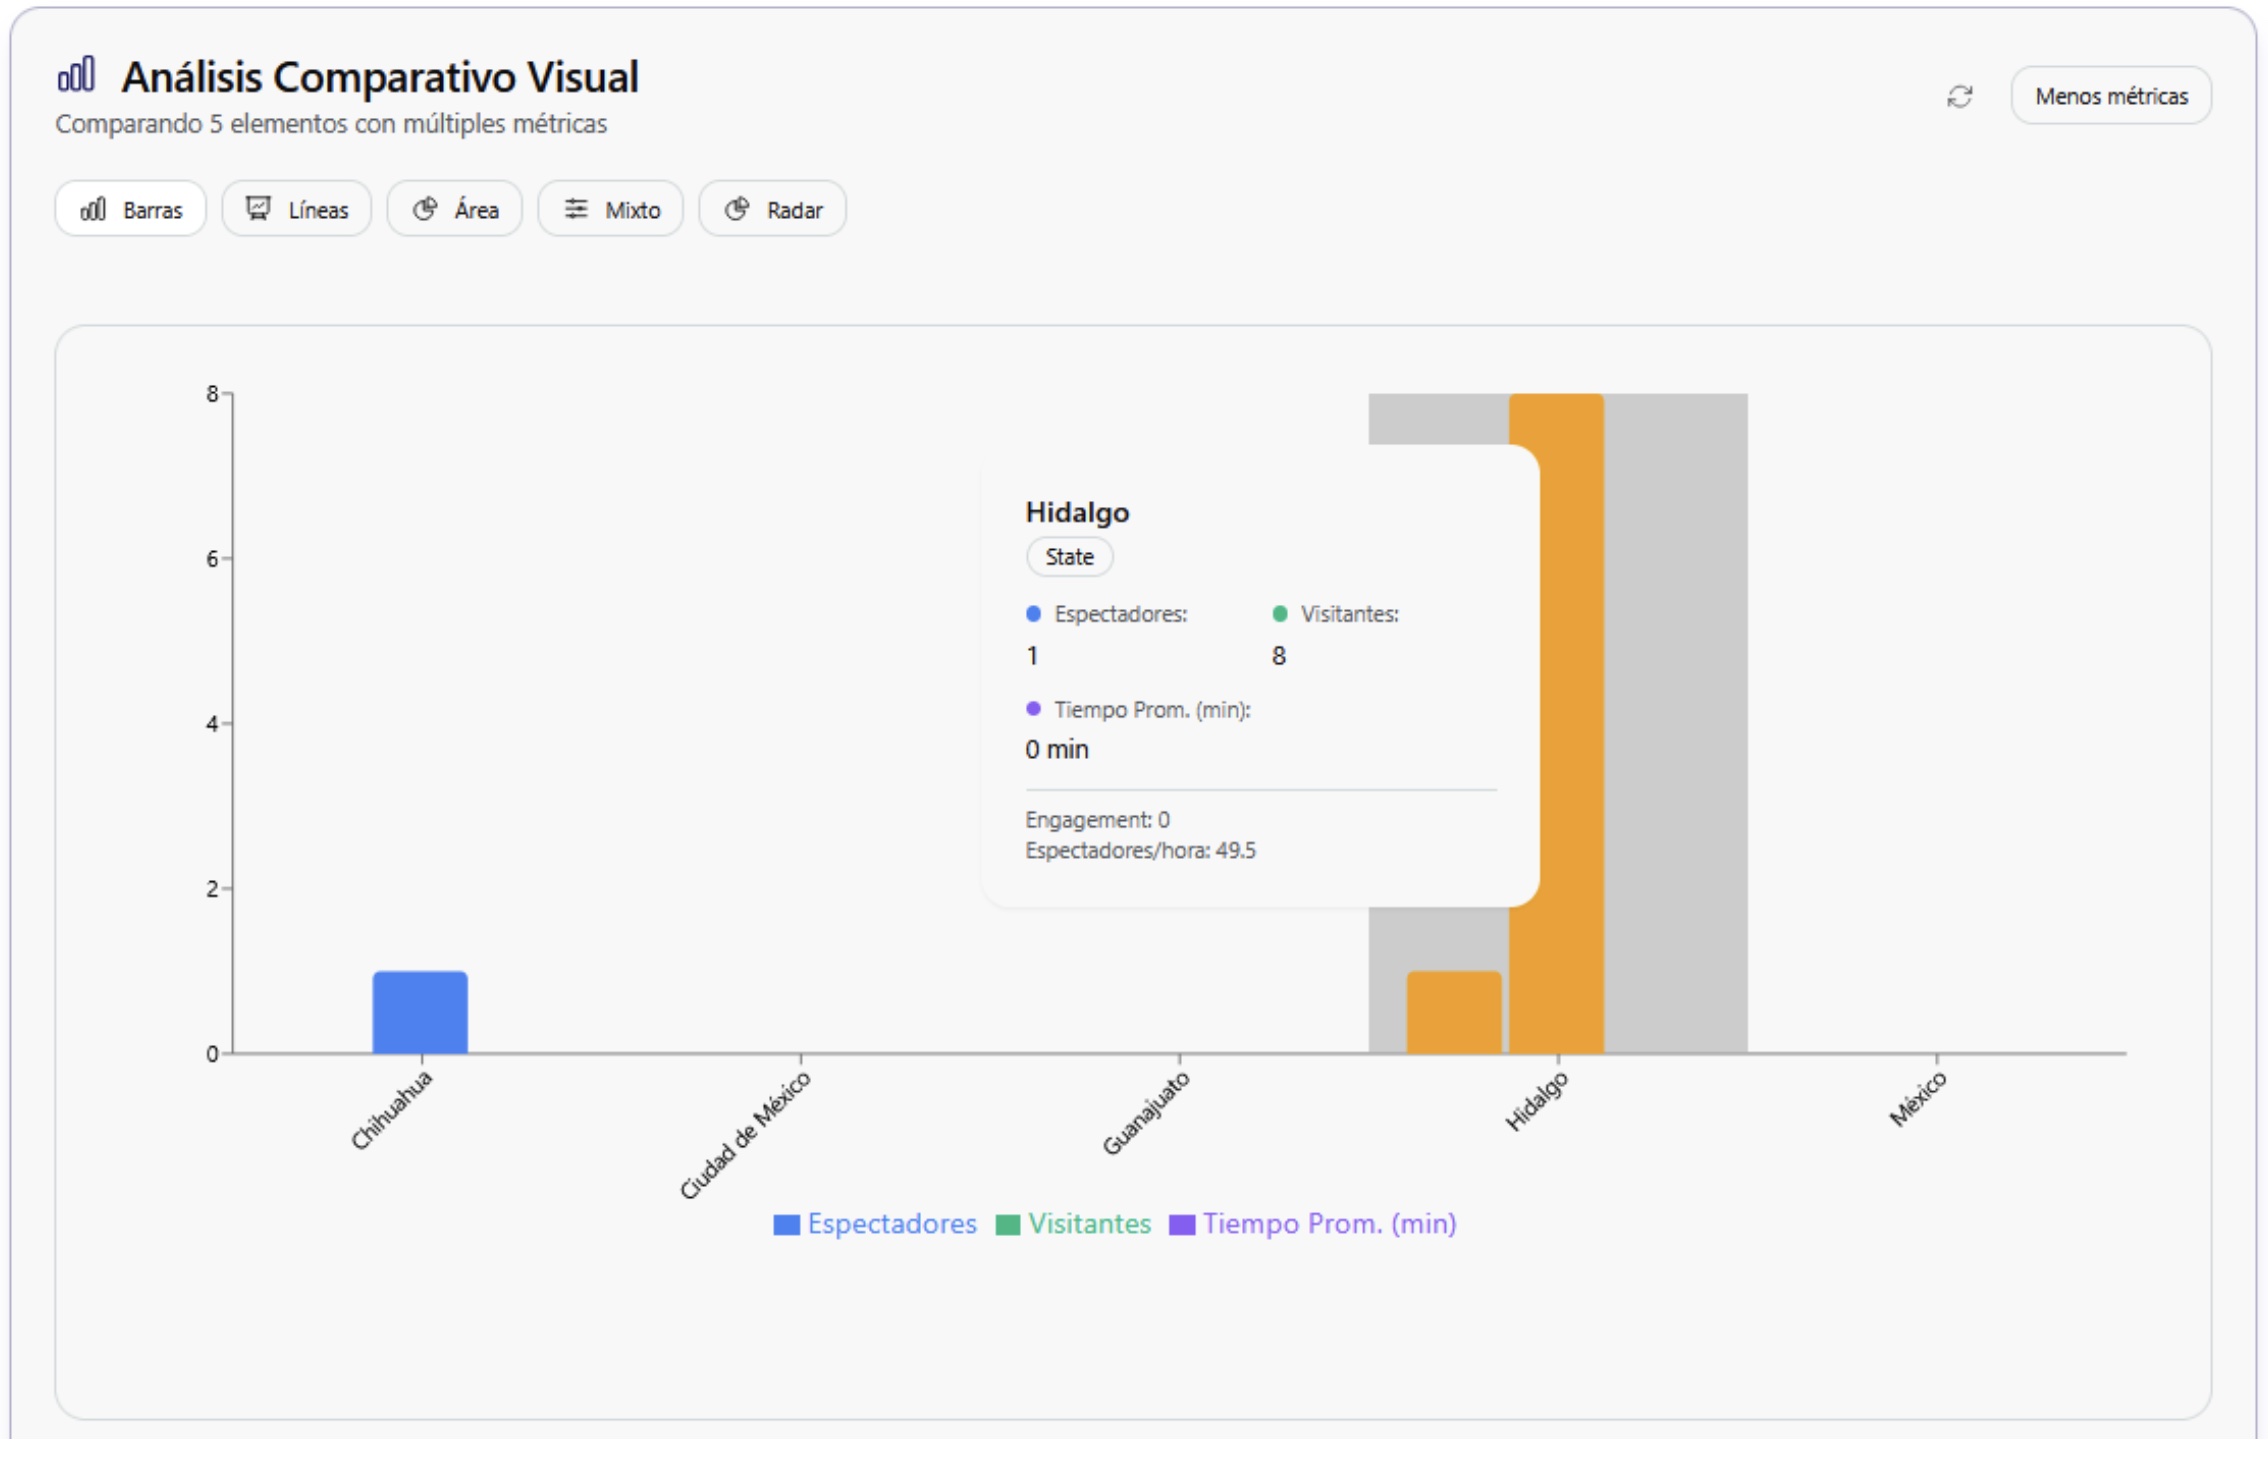
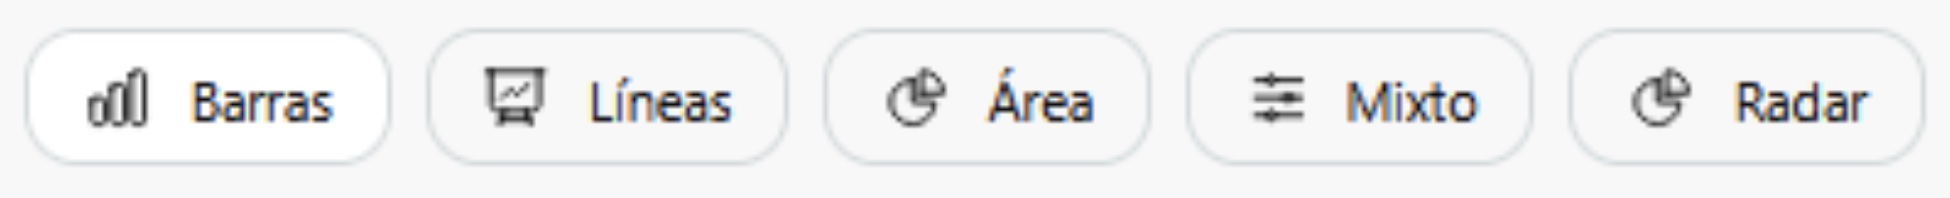
To change the type of graph, a series of options is shown in the upper left corner. By clicking on these graphs, the adjusted data will be displayed immediately.
Below the selected graph, the "Analysis Insights" section is displayed, which shows a summary of the compared data, as well as the selected elements.