Map
This map presents the geographical distribution of the devices, visually showing where they are deployed.
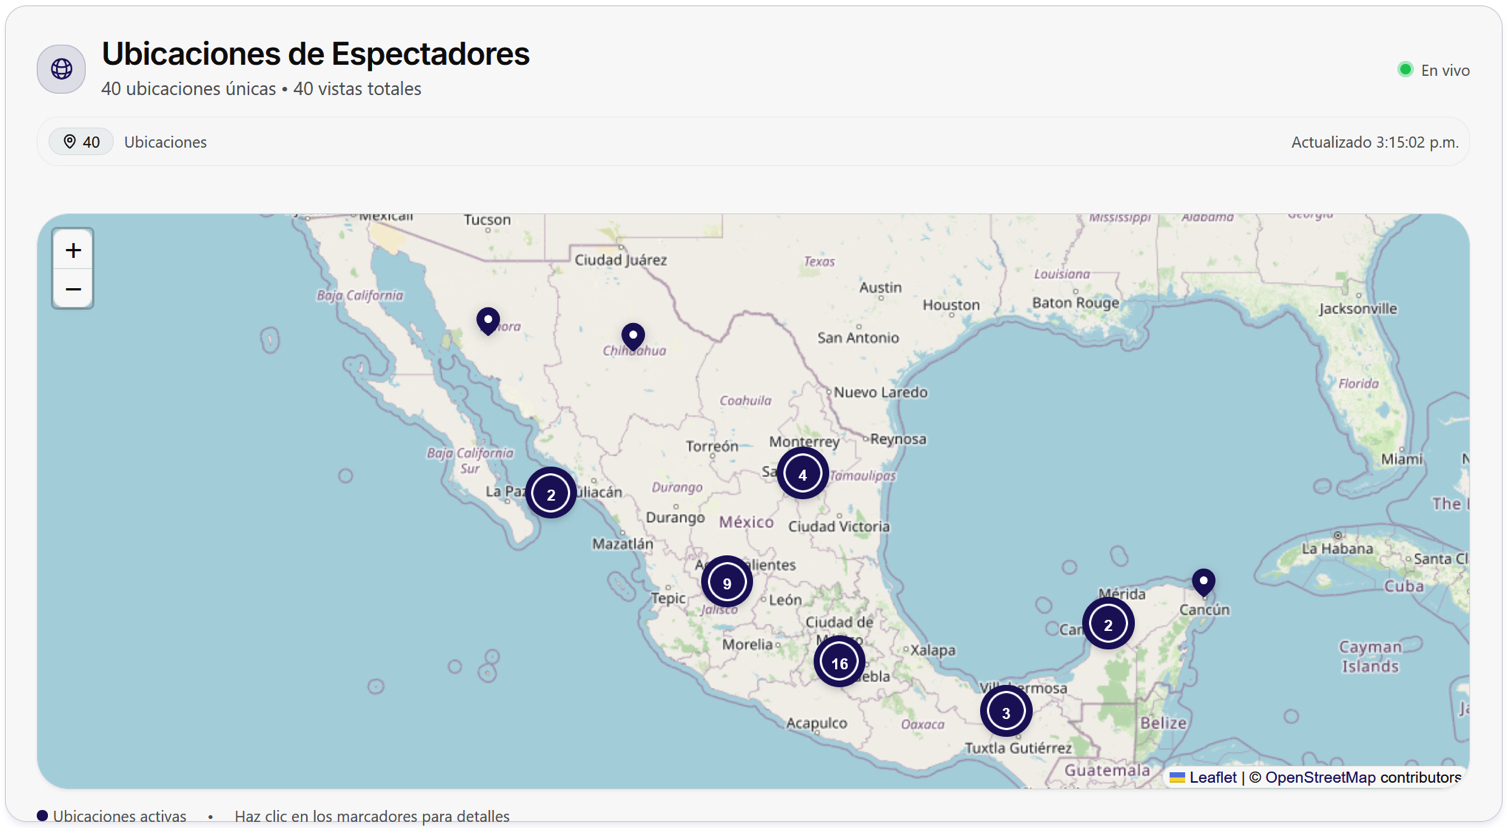
Below the title "Viewer Locations" is displayed the number of locations and views obtained for the registered devices.
In the case of locations with this marker  indicate that there is only one location at the indicated point. The map also groups device locations into markers that show a total number within a circle
 ![]() . This number represents the number of devices concentrated in a specific area. As you zoom in, these markers break down into more detailed locations, allowing you to visualize the exact distribution of devices more accurately.
Clicking on any location will open an informative window with the preliminary details of the assigned devices.
. This number represents the number of devices concentrated in a specific area. As you zoom in, these markers break down into more detailed locations, allowing you to visualize the exact distribution of devices more accurately.
Clicking on any location will open an informative window with the preliminary details of the assigned devices.
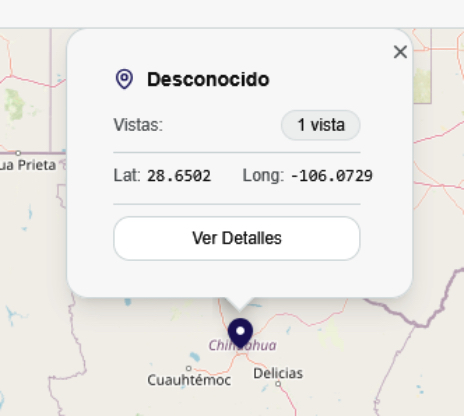
The first line of the window will display the name of the location. This name is customized and can be assigned as the user decides, for example, it can be named "North Store" or "TN-001". Next, it shows the number of views, these views will be displayed by default for a period of 7 days. After the views, the latitude and longitude of the location are shown, and finally, we find a button called "See details", when pressed, it shows the following information.
🔩 See details
Location Details
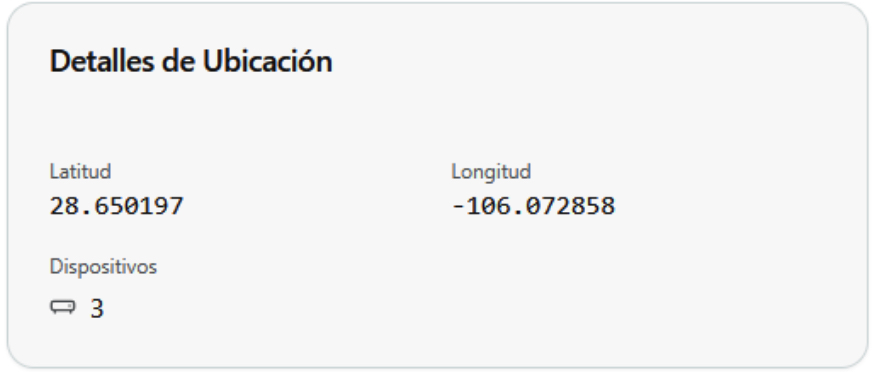
This card shows the latitude and longitude again, as well as the number of devices assigned to that location, for example, if we have a 3-story building, we may have one active device per level.
Location map
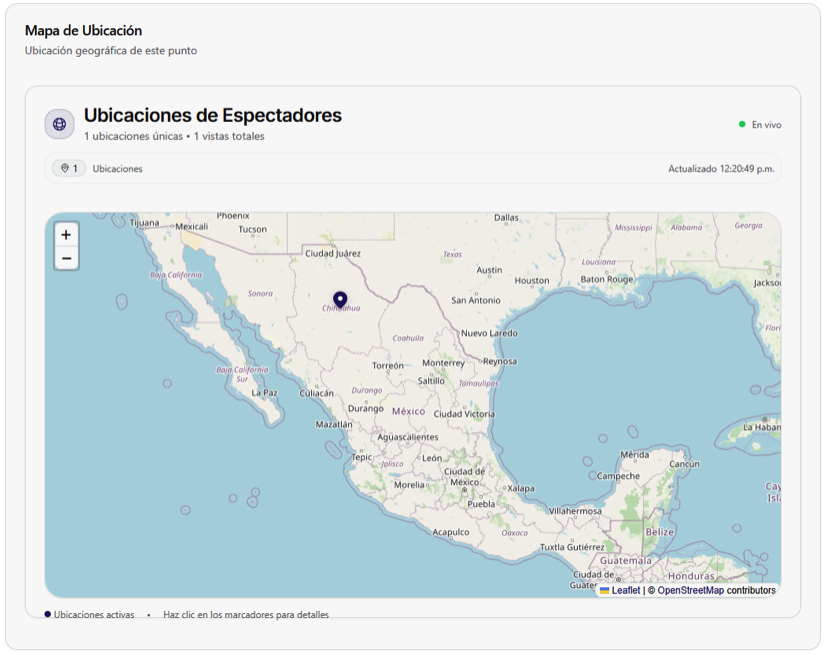
This map highlights only the marker of the selected location. To see all locations again, you must return to the previous map by clicking on the "Back to map" button  .
.
Devices
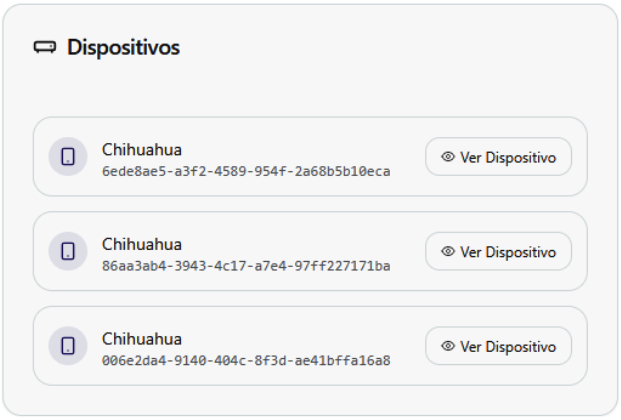
Here is a list of active devices. The first line shows the name assigned to it, assuming we have a device assigned to a specific floor, this device could be named "Floor 1" or "North Zone". All names are customizable according to the needs of the project. Below the name, an ID generated automatically by Elenix is displayed, this ID is not customizable. We can also access additional information by pressing "See device"
📱 See device
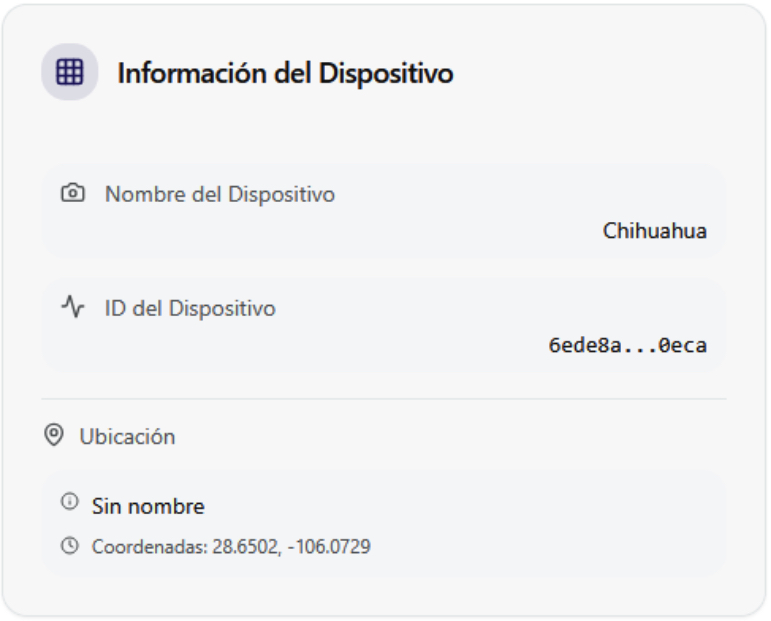
This section details the location of each device with additional information such as the address where they are located.
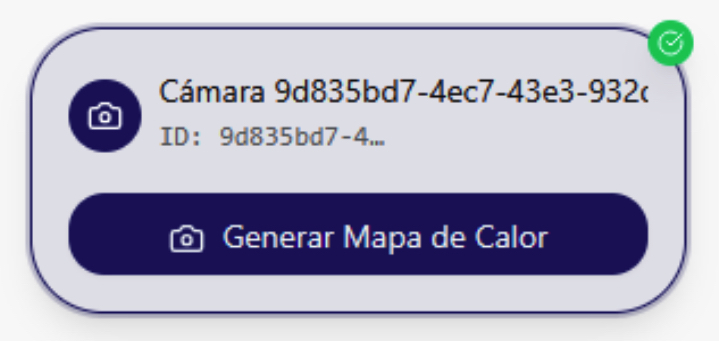
The cameras assigned to each device are also shown, for example, if we have 4 cameras available, the list and name of each one is shown here.
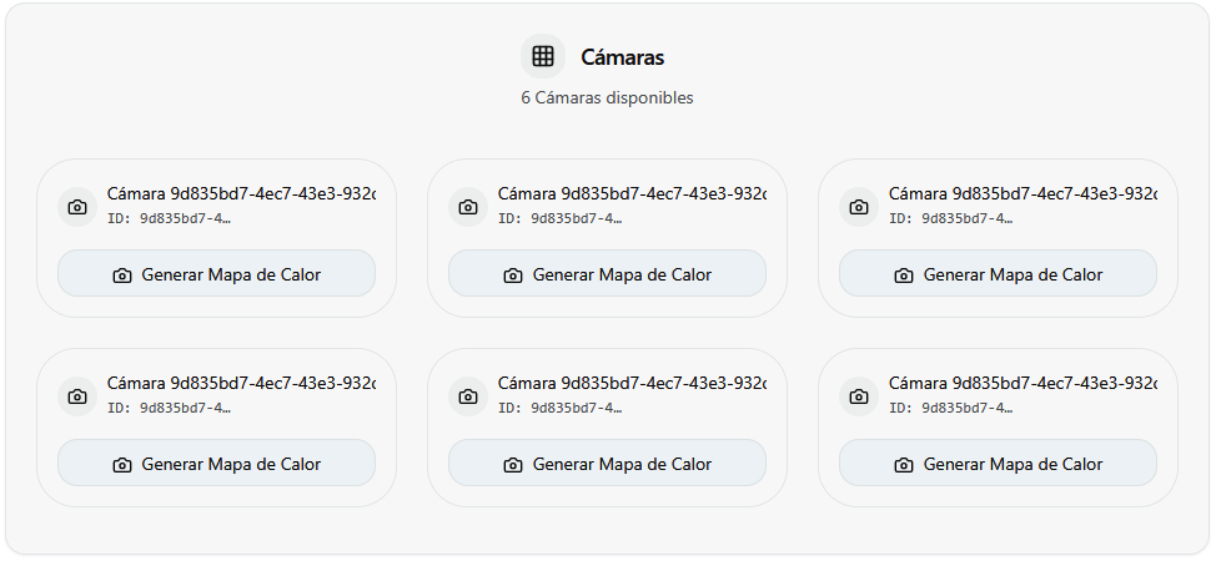
If we have a Plus Membership, we can generate images by pressing "Generate heat map". This tool, as its name indicates, will create a heat map of the selected camera in the desired range.
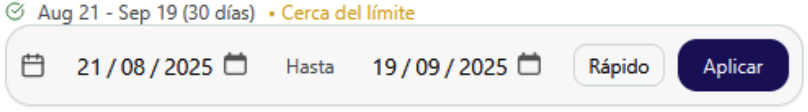
To select the desired range, we must make the selection from the calendar in the upper right corner, as in the other sections. This range will apply to all cameras equally.
Once the image is generated, a new window will open to show a preview.
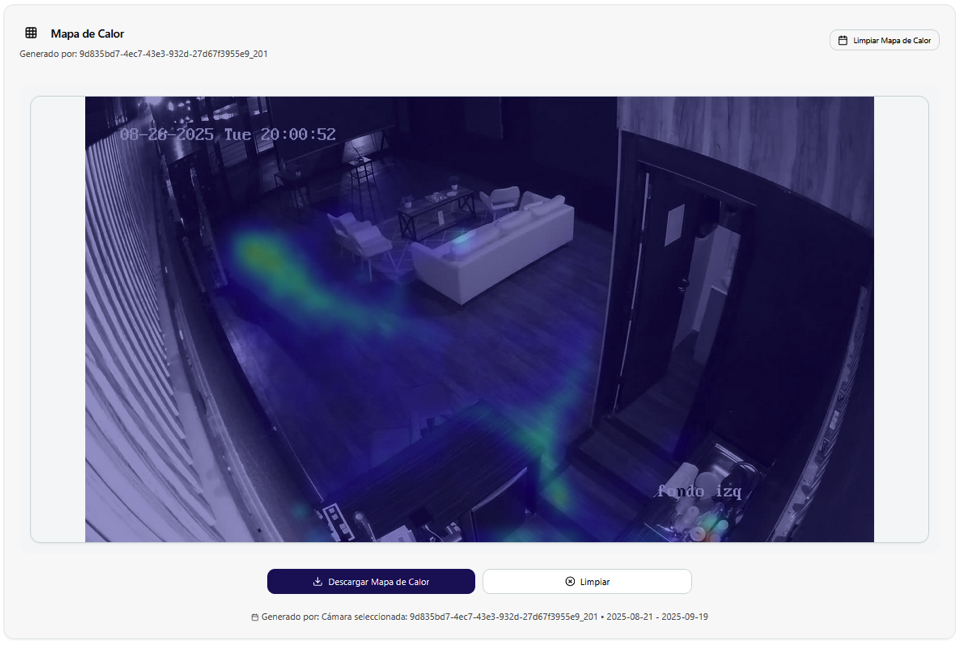
In the upper right corner, there is a "Clear heat map" button  when pressed, the generated map will disappear, to recover the image you must repeat the process. By clicking on "Download heat map"
  a .png file will be downloaded. We can only generate images one at a time and download them individually.